Quick Reference Guide for Hypothesis Testing
Two-tailed test (non-directional) |
One-tailed test (directional) |
|
The question being asked is, "Is the mean of one sample significantly different (either more or less) than the mean of the other sample (H1), or is the difference in the values of the sample means simply due to chance (H0)?"
|
The question being asked is, "Is the mean of one sample significantly higher (or lower) than the mean of the other sample (H1), or are they close enough that we can say there is no statistically significant difference (H0)?"
|
T-test for related samples |
T-test for independent samples |
|
In related samples, the two sets of scores come from either a single group that was tested twice (before and after) or from two different groups that are matched, such that each person/thing in one group is equivalent to a person/thing in the other group. Examples of correlated groups include identical twins, pairs of people matched for age/gender/socioeconomic status/etc, items from the same lot number, etc.
|
In independent samples, the two sets of scores come from different groups that are not matched in any way.
|
Z vs T
This video clearly explains when to use the z-score and when to use the t-statistic. It depends on whether or not you know the population standard deviation or the sample standard deviation. However, we can also note that the two values become very similar when sample size N is large (>30).
Formulas for z and t, and when to use them
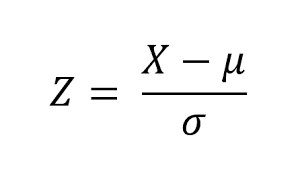
Z-score |
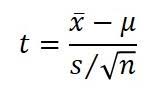
T-test |
|
Use this formula for the z-score when you are comparing a SINGLE VALUE to a population mean.
|
Use the t-statistic when you don't know the standard deviation of the population (sigma).
|
|
|
|
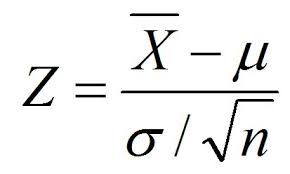
Use this formula for the z-score when you are comparing a SAMPLE MEAN to a population mean.
|
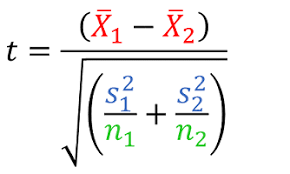
Use this formula when you are comparing independent samples:
|
|
Use this formula when you are comparing related samples:
First calculate the difference between the two values in each row. The rest of the calculations are performed on the differences, not the original numbers. d-bar is the average of the differences s-d is the standard deviation of the differences n is the number of rows 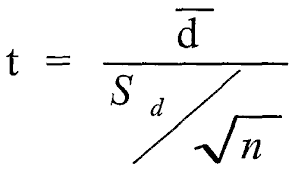
|
